Thinking about buying, selling, or investing in Bronzeville but not sure where prices and inventory stand? You are not alone. Whether you are timing a sale, hunting for a renovated two‑flat, or analyzing your next rehab, a clear read on the local numbers makes every decision easier. In this guide, you will learn how to interpret Bronzeville’s pricing, supply, and demand signals so you can move with confidence. Let’s dive in.
How we define Bronzeville
For clarity, this article uses the following working boundary: 31st Street to 51st Street, Lake Michigan to the Dan Ryan Expressway. Local definitions vary, and small shifts in the border can change the data. When you review market stats, make sure the boundary is stated so you are comparing apples to apples.
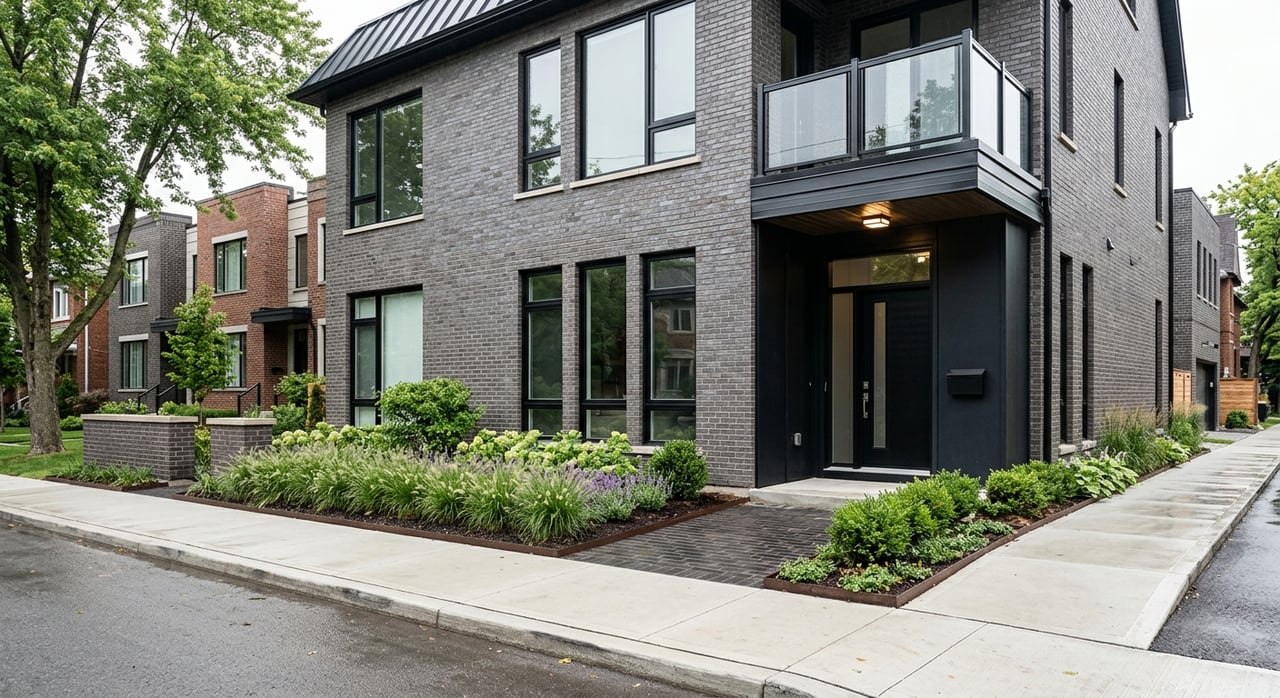
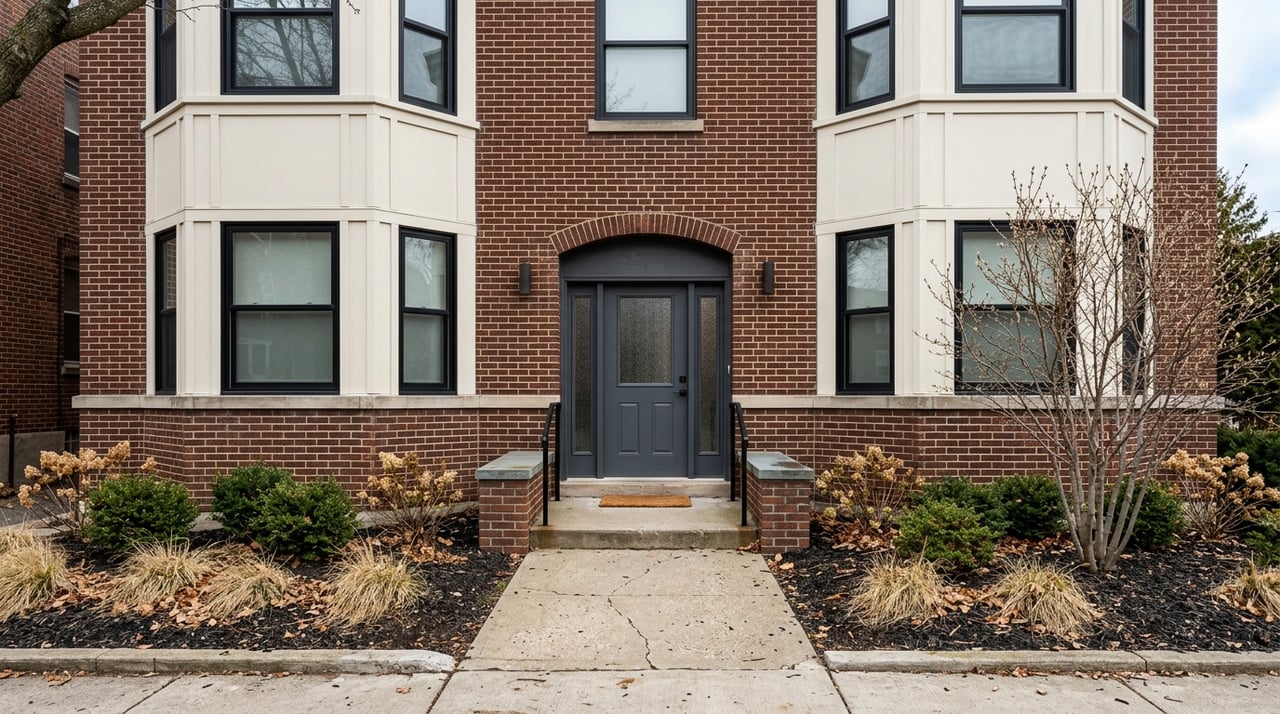
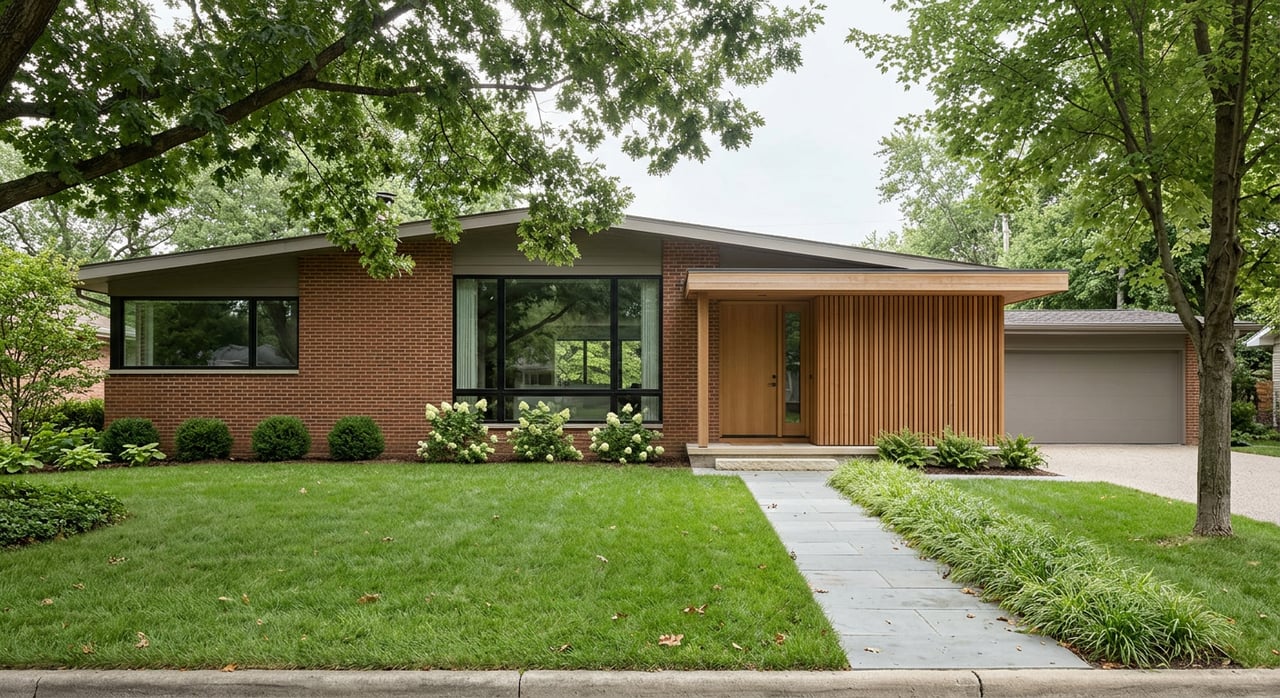
Bronzeville’s housing stock spans historic brick single‑family homes, two‑flats, classic rowhouses, and a wide range of condominiums and townhomes. You will also find pockets of new construction and substantial renovations. The neighborhood’s cultural history and landmark designations can shape renovation choices, so factor permitting and exterior guidelines into your plans if you are buying or updating a vintage property.
Prices: what to watch
Pricing is more than a single median. To understand value in Bronzeville, track:
- Median sale price and price per square foot, both trailing 12‑month and month‑by‑month to show trend and seasonality.
- Distribution, not just the middle. Look at the 10th and 90th percentiles to see the spread between entry points and higher‑end sales.
- Condition tiers. Separate new construction, recently renovated, and unchanged homes. New and fully updated homes typically command a premium.
- Property type and size. Single‑family, condo, and townhouse segments behave differently. Price per square foot can help normalize across sizes.
How to interpret pricing
- Rising medians can reflect broad appreciation or a shift in the mix toward more new builds or larger homes. Check segment detail before drawing conclusions.
- Compare Bronzeville’s medians to Chicago citywide and nearby areas like Hyde Park or the South Loop for context on relative value.
- Use a 12‑month rolling median to smooth out small‑sample swings. Bronzeville’s monthly closings can be modest, so single months may look volatile.
Inventory and months of supply
Inventory tells you who has the advantage.
- Months of supply is active listings divided by the average monthly sales pace.
- General rule of thumb:
- Less than 3 months favors sellers.
- 3 to 6 months is balanced.
- More than 6 months favors buyers.
Bronzeville supply patterns
- Expect differences by property type and condition. Renovated homes and new townhomes can sell faster than properties that need full updates.
- Track new listings and the net change in inventory. If new listings are outpacing pendings, supply is building and buyers gain leverage. If pendings are absorbing new listings, pricing power tilts to sellers.
Speed and demand: DOM and negotiation
Speed indicators show buyer urgency.
- Median days on market (DOM) for sold listings reveals how quickly homes are moving. Compare to DOM for active listings to see what is sitting.
- The list‑to‑sale price ratio shows negotiation power. A ratio near or above 100 percent indicates tight pricing and strong demand. Lower ratios suggest more room to negotiate.
- Watch the pending ratio, or the share of new listings that go under contract within a defined window. Higher pending ratios signal strong demand.
What sellers and buyers should do
- Sellers: If DOM is falling and list‑to‑sale ratios are tight, price near the market and focus on presentation. If DOM is lengthening, lead with condition and value, and revisit pricing quickly if showings lag.
- Buyers: If quality listings go pending within days, have pre‑approval ready and move fast. If the market is slower, use DOM and list‑to‑sale trends to negotiate repairs or credits.
Sales volume and buyer profile
Closed sales counts help you understand liquidity, which matters for pricing, appraisals, and exit strategy.
- Track monthly or quarterly closings and compare year over year.
- For investor insight, look at proxies like the percentage of all‑cash deals and LLC purchases. Higher shares often signal investor activity.
- If you plan to hold rentals, review average rents and local vacancy trends alongside purchase pricing to gauge projected cap rates.
New construction vs renovation mix
Bronzeville typically shows a blend of renovated historic homes and incremental infill or townhome projects. To quantify the mix:
- Use MLS fields such as year built and new construction flags, plus listing photos and remarks that indicate gut rehabs or major updates.
- Cross‑check with the City of Chicago’s building permits to confirm true new builds versus significant renovations.
- Express the mix as a percentage of closed sales for the past 12 months. This helps you price a renovated property against the right comps and understand premiums for new builds.
Why this matters
- Appraisals often hinge on comparing like to like. A renovated 1890s rowhouse should be comped against similar rehabs, not brand‑new construction down the block.
- Developers and investors use the mix to plan pipeline timing and product type. If renovated stock is scarce and DOM is short, a well‑executed rehab can fill a clear demand gap.
What drives Bronzeville trends
Understanding local drivers helps you anticipate change rather than react to it.
Seasonality and timing
Chicago’s market is typically busiest from March through June, active through summer, and slower in fall and winter. In Bronzeville, newer infill projects may list when construction wraps, which can add off‑cycle bursts of supply. Use several years of monthly data to filter out anomalies.
Transit, access, and amenities
Proximity to CTA Green Line stations, the lakefront, parks, museums, and nearby institutions like Illinois Tech and major hospitals tends to support demand. Homes near strong access points often show higher price per square foot compared to similar homes farther from transit or amenities.
Preservation, zoning, and policy
Historic districts and landmarked properties may have exterior guidelines that shape rehab scope and cost. Zoning and lot‑coverage rules influence what you can build or add, from coach houses to townhome clusters. Public incentives or requirements, including affordability rules or tax‑increment financing areas, can also steer development activity.
Mortgage rates and financing mix
Shifts in interest rates directly affect affordability. When rates rise, purchasing power steps down, and buyers become more price sensitive. Monitor the share of FHA and VA financing versus conventional loans to gauge sensitivity at different price bands.
Investor activity and costs
Watch local announcements about larger developments and track cash deal share for signs of increased investor interest. Renovation and construction costs, from labor to materials, will influence whether a rehab pencils out and what finishes are realistic within your budget.
Blocks that command premiums
Without naming specific micro‑areas, a few patterns are common:
- Homes close to the Green Line, major bus corridors, and strong east‑west connectors often see stronger demand.
- Proximity to parks, the lakefront, and cultural anchors can support higher price per square foot when condition is comparable.
- Newer townhome clusters or cohesive infill on a given block can set pricing benchmarks for nearby resales.
Always compare by condition and property type. A renovated two‑flat near transit will price differently than an unrenovated single‑family home a few blocks away.
How to use this market info
Use these steps to translate data into decisions:
If you are buying
- Define your property type, budget, and must‑have features first. Then compare price per square foot and DOM in that segment.
- Watch the pending ratio and new‑listing cadence. Move quickly on well‑priced renovated homes if absorption is strong.
- If months of supply is higher, negotiate for repairs, credits, or rate buydowns and look at homes that have been on market longer.
If you are selling
- Pull 12‑month comps for your property type and condition, and track active competition. Price within the tightest comp set.
- Invest in the updates that consistently drive value in your segment. In vintage homes, systems, kitchens, and baths matter for appraisals and buyer confidence.
- Time your launch for peak buyer traffic if possible, but do not wait if months of supply is low right now in your niche.
If you are investing or developing
- Underwrite with conservative rent and exit assumptions. Verify your scope against permitting requirements and historic guidelines when applicable.
- Track the share of renovated versus new construction sales, and target the gaps. If renovated two‑flats are undersupplied, a thoughtful rehab may capture outsized demand.
- Monitor cash and LLC purchase shares to size up investor competition and likely hold periods.
Methodology snapshot
To build a reliable Bronzeville read, align your method with the following:
- Boundary: 31st to 51st, Lake Michigan to Dan Ryan. Document the exact polygon you use for MLS pulls.
- Time frames: Trailing 12 months for medians and price per square foot, with month‑by‑month for the last 24 to 36 months to show trend and seasonality.
- Breakouts: Property type, bedroom count, and condition tiers, plus new construction versus renovated versus unchanged where feasible.
- Indicators: Active, new, pending, and closed counts, months of supply, median and percentile prices, DOM, list‑to‑sale ratio, pending ratio, and financing type.
- Cross‑checks: Validate MLS results against Cook County records and Chicago building permits. Note your “as of” date so readers know the data period.
Ready to move with confidence?
If you want a current, boundary‑specific Bronzeville data brief and a plan tailored to your goals, let’s talk. From buyer and seller representation to ground‑up consulting and rehab coordination, you can plug into local intelligence, vetted vendors, and strong marketing through @properties | Christie’s. Start your next move with a clear strategy and the right numbers by connecting with Naja Morris.
FAQs
What is the median home price in Bronzeville right now?
- The answer depends on property type and condition. A boundary‑specific MLS pull using a 12‑month median will give the cleanest read and reduce monthly volatility.
How many months of supply does Bronzeville have?
- Months of supply changes by segment. Under 3 months favors sellers, 3 to 6 months is balanced, and over 6 months favors buyers. Check your property type and condition tier.
Are renovated homes or new builds more common in Bronzeville?
- It is a mix. Use MLS year‑built filters and the City of Chicago permits database to estimate the share of new construction versus significant rehabs over the past year.
How fast do Bronzeville homes sell on average?
- Look at median days on market for sold listings in your segment. Compare it to active‑listing DOM to see what is moving quickly versus sitting.
Is Bronzeville attractive for investors today?
- Investors track cash and LLC purchase shares, rent trends, and renovation costs. If renovated inventory is tight and DOM is short, well‑executed rehabs can be compelling.
When is the best time to list a Bronzeville home?
- Spring is typically the busiest in Chicago, with strong activity continuing into summer. That said, low inventory in your niche can make a winter launch successful.
Do historic designations affect my renovation?
- They can. Landmark and historic district guidelines may shape exterior changes. Confirm permitting requirements before you finalize scope or pricing.